Overview
Skyline is a Python based time series analysis and performance monitoring application that helps you to monitor and better understand complex systems and their interactions. Skyline provides a unique kind of performance monitoring by using real time anomaly detection, threshold and dynamic threshold analysis, user input/training for machine learning with various correlation methods, to provide structured data sets of significant changes within metric populations.
Features
Skyline use the most appropriate state of the art algorithms for real time anomaly detection.
Uses multi stage analysis and filtering to allow for the use of more time complex algorithms to be applied in the real time domain.
Puts the user in control of false positive detections by allowing for simple user input to provide explainable ML methods with training data which massively reduce false positive detections and provides the system with data to begin learning with.
What is anomaly detection and time series analysis performance monitoring good for?
It is extremely useful in the operations and development arenas, to highlight a few use cases:
In operations monitoring to provide a real time feed of significant changes and related events in your systems, the good, the bad and the unknown and unseen.
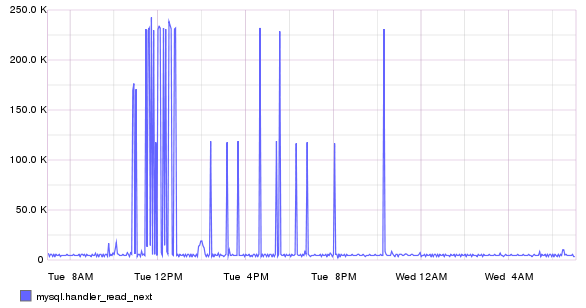
Enabling developers to monitor components of their development environment helping them to build for performance by giving them a real time view of any performance related impacts any new feature may introduce. For example a developer may create a new feature that periodically runs analysis on some data from a MySQL database. The developer builds the feature, tests it to ensures that it provides the required functionality and releases the feature. The feature works but it introduces an additional 225K of mysql.handler_read_next operations on every run, which were not there before the feature was released. The developer method works, but it could work much better. Skyline provides the developer with information to enable them to be the best they can be in terms of performance and understanding impacts, in a areas where they may have zero or little domain knowledge, such as the internal metrics of MySQL/MariaDB.
Our work can always be better.
The question is why are we NOT doing anomaly detection on our things? Shouldn’t we be analysing our observability data? If the 3 pillars of observability are:
logs
metrics
traces
What do pillars hold up?
Data analysis is the next generation of the observability stack, o11y 1.0 was about collection, storage, retrieval and presentation. Anomaly detection is is a part of the next generation of observability, putting all that data to use in real time - analysis.
What can Skyline be compared to
Although it may seem that there are various services and applications that might be compared to Skyline, in reality most of them are not comparable, for a variety of reason.
Google, AWS and Azure all have some kind of anomaly detection service for timeseries data, but those services are generally one trick ponies or one or two trick black boxes.
What none of those are is a dedicated, multi stage analysis pipeline with first and foremost human in the loop in terms of configuration, choice and model training.
Skyline currently allows for 12 analysis stages by default implementing a number of different analysis methods:
analyzer - 3-sigma (to stage 2 if anomalous at 24h)
mirage - 3-sigma (to stage 3 if anomalous at 7d)
mirage - matrixprofile (to stage 4 if anomalous at 7d)
mirage - anomalous_daily_peaks (to stage 5 if not a normal daily peak)
mirage - irregular_unstable (to stage 6 if true or to stage 7 if not true and trained instances available)
mirage - 3-sigma/matrixprofile/spectral_residual (to stage 7 if anomalous at 30d and trained instances available)
ionosphere - motif matching on 24h trained data (to stage 8 if no matches found)
ionosphere - motif matching on 7d trained data (to stage 9 if no matches found)
ionosphere - features extracted and compared to 24h trained data (to stage 10 if no matches found)
ionosphere - minmax features extracted and compared to 24h minmax trained data (to stage 11 if no matches found)
ionosphere - features extracted and compared to 7d trained data (to stage 12 if no matches found)
ionosphere - minmax features extracted and compared to 7d minmax trained data
Skyline is unique. It is the only real open source anomaly detection system, that allows for state of the art (SOTA) on realtime data and plugs into our existing telemetry systems to enable realtime anomaly detection on your metrics and even traces (converted to metrics).
Skyline allows you to specify what algorithms to run, and even allows you to add your own, it allows you to provide the system with valid training data with the click of a button. It records all anomalies, analysis results and reports on performance on a per metric basis. You can even evaluate your own or other algorithms in the real time pipeline, without having them influence the outcome of any existing analysis. This allows for benchmarking the actual performance of algorithms on your own real data.
And it is cluster ready for production. However be warned, it is a complex stack to set up and implement, once running it is fine, it bit like my Mercedes MB120 van which has 662000 km on the clock. However, like my van, it runs perfectly fine but when it comes to upgrading all the components and the app itself is a fairly large slice of orchestrated work, not for the faint hearted.
human-in-the-loop
The use multi-stage analysis and multiple algorithms decreases false positive detections. However false positives are inevitable so the user can easily train Skyline, which enables massive reductions in false positives by utilising extracted features and shapelets/motifs from the user trained time series and running various state of the art similarity search methods against potentially anomalous instances of data. These methods are extremely accurate and achieving a False negative rate of ~0.34% on a sample of 1000 matches from 246799 matches achieved over a period a 55 month period on the real time analysis of production system and application metrics. Meaning that the system flagged an instance of data as matching a trained instance of data incorrectly only 838 times and it matched correctly 245961 times over the 55 month period.
Your input is more valuable than you know or even imagine! Even though you may think you know nothing or very little about metrics, you and your brain can be magnificent.
In the world of machine learning achieving a 0.34% error rate on classifications is not bad, whether that be unsupervised, semi-supervised or a supervised machine learning algorithm, 0.34% is not bad, it is within acceptable limits in the context of what it is doing.
It must be caveated that this error rate can be affected by data quality, currently no checks are implemented to ensure that the potentially anomalous timeseries being checked is the same length or at least similar length to the trained data set to which it is being compared. Although the SITTSSCA method is fairly robust to some missing data, more dissimilar length timeseries will produce increasingly dissimilar features and the chance of them matching decreases quite rapidly.
Skyline is built for speed.
The analysis stages move from very simple and efficient algorithms, to more complex and specialised algorithms through the analysis pipeline. This ensures that more computationally expensive analysis is only carried out when it is needed and all analysis is conducted as fast as possible.
Every optimisation that can be found is implemented, whether that be optimising a 0.077915 second operation to 0.005692 seconds with the use of bottleneck rather than pandas or finding optimisations in the algorithmic methodologies and pipeline and gaining wherever possible on suitable algorithms/methods with numba JIT compiled algorithms, every millisecond counts. We are not talking about nanoseconds here because we are dealing with big data sets, so we must be realistic.
Unfortunately no single anomaly detection algorithm or method or service is perfect. Using any a single method to do anomaly detection is a flawed approach and achieves suboptimal long term results. Anomaly detection is a constantly shifting space with new methodologies/papers/libraries published almost daily. However the truth is that real world, real time implementations of high volume and high frequency metrics of many of these new methodologies/papers/libraries published are very few and far between. And often they do not fit into the real time space, for many reasons, a few are:
computational time complexity
need for tuned hyperparameters on different types of data sets
need for labelled data
Skyline attempts to implement methods that work with zero domain knowledge, as the system runs and records data, it uses the data it creates itself to do zero knowledge discovery of relationships in the metrics and learn about them.
Anomaly detection is not simply about fault detection and identifying problems, anomaly detection is about describing significant changes. Skyline creates a real time event stream of significant changes to inform the user of what is happening on their systems, applications and metrics of interest. Do not think of Skyline as an alerting system, think of it as an event stream that can be trained.
Skyline teaches you about your systems and allows you to train it on what is normal. You can even configure it to try and learn for its self from what you trained it on.
Skyline runs on Linux on commodity hardware or a cloud instance.
At its core Skyline can currently makes use of the uses the following algorithms (or modifications thereof):
9 three-sigma based algorithms, derived from Shewhart’s statistical process
SITTSSCA - Skyline-Ionosphere-Tsfresh Time Series Similarities Comparison Algorithm
matrixprofile
various adtk algorithms - level shift, volatility shift and persist
spectral_residual
DBSCAN
Local Outlier Factor (lof)
PCA - Principal Component Analysis
Isolation Forest
Prophet
One Class SVM
MSTL
Spectral Entropy
Moving Average Convergence/Divergence
m66
AutoARIMA
Any custom algorithm you want it to run, a bit like a lamdba function.
Too much effort?
anomify offer a managed version of Skyline for people that do not have a vast amount of time to spare. You’ll get access to unreleased features and support from developers that have honed numerous Skyline integrations.
Anomify are looking for further test partners with various types of data and data sources, if you think you may have interesting metrics send an email to hello@anomify.ai and get in touch.
The main objectives are:
Provide an application that helps people monitor 10000s of metrics.
Provide an application that allows the user to EASILY use their own valuable domain specific knowledge to create training data to improve analysis by introducing human-in-the-loop feedback.
Computational efficiency
Accuracy
Reliability
Maximise the usage of user trained data.
Ongoing development, testing and implementation of relevant and applicable state of the art methods which have proven to result in improvements.
Low cost in terms of user time and money (compute and storage)