Analyzer
The Analyzer service is responsible for analyzing collected data. It has
a very simple divide-and-conquer strategy. It first checks Redis to get
the total number of metrics stored, and then it fires up a number of
processes equal to settings.ANALYZER_PROCESSES, assigning each
processes a number of metrics. Analyzing a metric is a very
CPU-intensive process, because each time series must be decoded from
Messagepack and then run through the algorithms. Analyzer also routes
metric checks to other services (Mirage, Panorama and Ionosphere) for
further analysis or recording an anomaly event, as appropriately, more on that
later.
Due to Analyzer being one of the most CPU-intensive Skyline process, it is
advisable to set settings.ANALYZER_PROCESSES to about the number of cores
you have - leaving a few for the Skyline services and Redis.
The original documentation and settings for skyline were based on:
a flow of about 5k metrics coming in every second on average (with 250k distinct metrics). We use a 32 core Sandy Bridge box, with 64 gb of memory. We experience bursts of up to 70k TPS on Redis
Skyline runs OK on much less. It can handle ~45000 metrics per minute on
a 4 vCore, 4GB RAM cloud SSD server, even before the introduction of the
settings.RUN_OPTIMIZED_WORKFLOW methodology.
Do read the notes in settings.py related to the
settings.ANALYZER_PROCESSES settings.ANALYZER_OPTIMUM_RUN_DURATION
if you are only processing a few 1000 metrics with a data point every minute
then the optimum settings will most likely be something similar to:
ANALYZER_PROCESSES = 1
ANALYZER_OPTIMUM_RUN_DURATION = 60
Python multiprocessing is not very efficient if it is not needed, in fact the overall overhead of the spawned processes ends up greater than the overhead of processing with a single process.
See Optimizations results and Analyzer Optimizations
Algorithms
Skyline Analyzer was designed to handle a very large number of metrics, for which picking models by hand would prove infeasible. As such, Skyline Analyzer relies upon the consensus of an ensemble of a few different algorithms. If the majority of algorithms agree that any given metric is anomalous, the metric will be classified as anomalous. It may then be surfaced to the Webapp or pushed to Mirage, if Mirage is enabled and configured for the namespace of the anomalous metric.
Currently, Skyline does not come with very many algorithmic batteries included. This is by design. Included are a few algorithms to get you started, but you are not obligated to use them and are encouraged to extend them to accommodate your particular data. Indeed, you are ultimately responsible for using the proper statistical tools the correct way with respect to your data.
Of course, we welcome all pull requests containing additional algorithms
to make this tool as robust as possible. To this end, the algorithms
were designed to be very easy to extend and modify. All algorithms are
located in algorithms.py. To add an algorithm to the ensemble, simply
define your algorithm and add the name of your settings.ALGORITHMS.
Make sure your algorithm returns either True, False or None, and be
sure to update the settings.CONSENSUS setting appropriately.
Algorithm philosophy
The basic algorithms are based on 3-sigma, derived from Shewhart’s statistical process control. However, you are not limited to 3-sigma based algorithms if you do not want to use them - as long as you return a boolean, you can add any sort of algorithm you like to run on time series and vote.
A break from traditions
As Skyline develops, the addition of non three-sigma algorithms and methodologies is inevitable. Further Skyline was designed to analyse all metrics via the three-sigma algorithms, however there are instances where this is not necessarily paramount and at times undesirable. Therefore a number of alternative methods and related configurations have been introduced to allow the operator to analyse high and low priority metrics differently.
High and low priority metrics
This supports the old monitoring mantra of “do not alert on everything, only alert on the important things”.
- High priority metrics: metrics that belong to a
smtpalert setting are classified as high priority metrics (even if thesmtpalerter is set to'no_email'). - Low priority metrics: metrics that do not belong to a
smtpalert setting.
High priority metrics always get routed through all the analysis stages. The amount of analysis done on low priority metrics is configurable.
With the default settings all low priority metrics are analysed through all the analysis stages just like high priority metrics. If you are not handling 1000s and 1000s of metrics, this default should be fine.
In installations with large metric populations the full analysis of all low priority metrics all the time is not necessarily desirable as it means that Skyline needs a lot more CPU time to analyses all the metrics.
The point of analysing low priority metrics is too also record anomalies on these metrics that are not alerted on, for the purpose of being able to related anomalies on high priority metrics with anomalies on low priority metrics. Although you do not want to be alerted on these, having them referenced in high priority metric training pages and in the anomalous events timeline can be useful for root cause analysis. However if there amount of time being taken to analyse all the metrics is resulting in lagging, Skyline can be configured to reduce the amount of analysis on low priority metrics to gain time to focus on getting through all the high priority metrics.
This can be achieved using MAD or disabling analysis of low priority metrics.
The analysis of low priority metrics can be turned off by setting
settings.ANALYZER_ANALYZE_LOW_PRIORITY_METRICS to False.
Do note that low priority metrics will still always be cross-correlated against in Luminosity even if the analysis of low priority is disabled, therefore this useful root cause analysis information is not lost. The total disabling of low priority metrics just results in there never being any anomalies recorded on low priority metrics.
There is an settings.ANALYZER_DYNAMICALLY_ANALYZE_LOW_PRIORITY_METRICS
mode which will attempt to dynamically analyse as many low priority metrics as
possible in the available time, looping through the metrics on a best effort
basis to analyse low priority metrics as frequently as possible without causing
lag on the analysis of high priority metrics.
ANALYZER_MAD_LOW_PRIORITY_METRICS
In order to reduce the required amount of analysis done by Analyzer to identify
potential anomalous metrics, the use of the mean absolute deviation (MAD)
algorithm can be used to determine whether to analyse the metric with the
three-sigma algorithms or not. This use of MAD is only implemented against low
priority metrics. Low priority metrics being metrics that do not belong to a
settings.ALERTS smtp alert setting. Metrics that belong to a smtp
alert setting are classified as high priority metrics and are always analysed
with the three-sigma algorithms.
MAD is a bit faster than running all the three-sigma algorithms, therefore in installations with large metric populations, running MAD on low priority metrics results in a marginal performance gain in terms of overall compute time. In large low priority metric populations the implementation of MAD results in approximately 30% of the low priority metrics not being checked with the three-sigma algorithms because MAD does not trigger on them and therefore they are not submitted to the func:analyzer.run_selected_algorithms function.
The use of MAD is not ideally suited to all variations in time series and could potentially result in false negatives where you would want the metric to be analysed with three-sigma. However given that this is intended to be used in large metric populations on low priority metrics only, occurrences of a few false negatives is not significantly important.
The performance benefit is only achieved if the number of data points used
to compute MAD for is very low, less than 16, ideally 10. Configuring
settings.ANALYZER_MAD_LOW_PRIORITY_METRICS to any value higher than this
results in a performance loss in terms of overall compute time.
Using custom algorithms
Originally the intent in Skyline was allow users to add any algorithms they wanted directly into algorithms.py:
"""
This is no man's land. Do anything you want in here,
as long as you return a boolean that determines whether the input
timeseries is anomalous or not.

To add an algorithm, define it here, and add its name to settings.ALGORITHMS.
"""
This is still of course possible, however it is not greatly useful if you do
not want your algorithm to be tied into the Skyline CONSENSUS methodology or
maintain the core algorithms files yourself. Therefore the easier and preferred
method is to use the settings.CUSTOM_ALGORITHMS functionality, which
allows you to load any Python source algorithm file you want and define the
algorithm in terms of CONSENSUS and what namespaces to run it against.
Explanation of Exceptions
TooShort: The time series was too short, as defined in
settings.MIN_TOLERABLE_LENGTH
Incomplete: The time series was less than settings.FULL_DURATION
seconds long
Stale: The time series has not received a new metric in more than
settings.STALE_PERIOD seconds
Boring: The time series has been the same value for the past
settings.MAX_TOLERABLE_BOREDOM seconds
EmptyTimeseries: The time series has no data and is removed from the :mod:`settings.FULL_NAMESPACE`unique_metrics Redis set and no longer submitted for analysis.
Other: There’s probably an error in the code, if you’ve been making changes or we have.
Metrics monotonicity
Analyzer is used to identify what metric time series are strictly increasing monotonically, metrics that have an incrementing increasing count, so that these time series can be handled via their derivative products where appropriate. For full details see Monotonic metrics
Anomaly end_timestamp
The end_timestamp means that the anomaly has either:
- Ended, when it is a peak or trough anomaly, and the time series data returns to a state that is represented in the norm in the previous 24 hour period
- When the state change, in cases of frequency or level shifts, and occurs for
sufficient time to begin to be represented in the norm in the previous 24 hour
period (
settings.FULL_DURATION). In these cases you might consider the metric to still be in an anomalous state, but in terms of thesettings.FULL_DURATIONdata, it is no longer anomalous.
Push to Mirage
Analyzer can push anomalous metrics that have a seasonality /
periodicity that is greater than settings.FULL_DURATION to the Mirage
service, see Mirage.
Push to Ionosphere
Analyzer pushes anomalous metrics that are ionosphere_enabled to Ionosphere to check if the anomalous time series is known to be NOT ANOMALOUS due to it’s features profile matching a known NOT ANOMALOUS trained or learnt features profile see Ionosphere.
analyzer_batch
analyzer_batch is a submodule of Analyzer that runs as an independent service
with the sole purpose of handling and analysing metrics that are not streamed in
real time but are updated in batches, every x minutes or hour/s.
It is a “lite” and slightly modified version of analyzer that works in
conjunction with analyzer to handle batch metrics.
By default analyzer_batch and settings.BATCH_PROCESSING related settings
are disabled.
It should only be enabled if you have metrics that are received in infrequent batches, metrics feed per minute do not require batch processing. For example if a metric/s are sent to Skyline every 15 minutes with a data point for each minute in the period, Analyzer’s default analysis would only analyse the latest data point against the metric time series data and not all the 14 data points since the last analysis, analyzer_batch does.
It is not default Analyzer behaviour as it adds unnecessary computational overhead on analysing real time metrics, therefore it is only implemented if required.
analyzer_batch and settings.BATCH_PROCESSING needs to be enabled if you
wish to use Flux to process uploaded data files, see
Flux.
Analyzer settings.ALERTS
For all the specific alert configurations see the Alerts page.
Order Matters
In terms of the settings.ALERTS order matters in Analyzer and in the
Mirage context as well.
Warning
It is important to note that Analyzer uses the first alert tuple
that matches. Unless you have settings.EXTERNAL_ALERTS enabled which
is an ADVANCED FEATURE.
So for example, with some annotation. Let us say we have a set of metrics related to how many requests are made per customer. We have two very important customers which we have tight SLAs and we want to know very quickly if there is ANY anomalies in the number of requests they are doing as it has immediate effect on our revenue. We have other customers too, we want to know there is a problem but we do not want to be nagged, just reminded about them every hour if there are anomalous changes.
ALERTS = (
           ('skyline', 'smtp', 3600),
           ('stats.requests.bigcheese_customer', 'smtp', 600),    # --> alert every 10 mins
           ('stats.requests.biggercheese_customer', 'smtp', 600), # --> alert every 10 mins
           ('stats.requests\..*', 'smtp', 3600),                  # --> alert every 60 mins
)
The above would ensure if Analyzer found bigcheese_customer or biggercheese_customer metrics anomalous, they would fire off an alert every 10 minutes, but for all other metrics in the namespace, Analyzer would only fire off an alert every hour if they were found to be anomalous.
The below would NOT have the desired effect of analysing the metrics for bigcheese_customer and biggercheese_customer
ALERTS = (
           ('skyline', 'smtp', 3600),
           ('stats.requests\..*', 'smtp', 3600),                  # --> alert every 60 mins
           ('stats.requests.bigcheese_customer', 'smtp', 600),    # --> NEVER REACHED
           ('stats.requests.biggercheese_customer', 'smtp', 600), # --> NEVER REACHED
)
Hopefully it is clear that Analyzer would not reach the bigcheese_customer and
biggercheese_customer alert tuples as in the above example the
stats.requests\..* tuple would match BEFORE the specific tuples were
evaluated and the bigcheese metrics would be alerted on every 60 mins instead of
the desired every 10 minutes.
Please refer to Mirage - Order Matters section for a similar example of how order matters in the Mirage context and how to define a metric namespace as a Mirage metric.
Analyzer SMTP alert graphs
Analyzer by default now sends 2 graphs in any SMTP alert. The original Graphite graph is sent and an additional graph image is sent that is plotted using the actual Redis time series data for the metric.
The Redis data graph has been added to make it specifically clear as to the data that Analyzer is alerting on. Often your metrics are aggregated in Graphite and a Graphite graph is not the exact representation of the time series data that triggered the alert, so having both is clearer.
The Redis data graph also adds the mean and the 3-sigma boundaries to the plot, which is useful for brain training. This goes against the “less is more (effective)” data visualization philosophy, however if the human neocortex is presented with 3-sigma boundaries enough times, it will probably eventually be able to calculate 3-sigma boundaries in any time series, reasonably well.
Bearing in mind that when we view anomalous time series in the UI we are presented with a red line depicting the anomalous range, this graph just does the similar in the alert context.
Should you wish to disable the Redis data graph and simply have the Graphite
graph, simply set settings.PLOT_REDIS_DATA to False.
Example alert
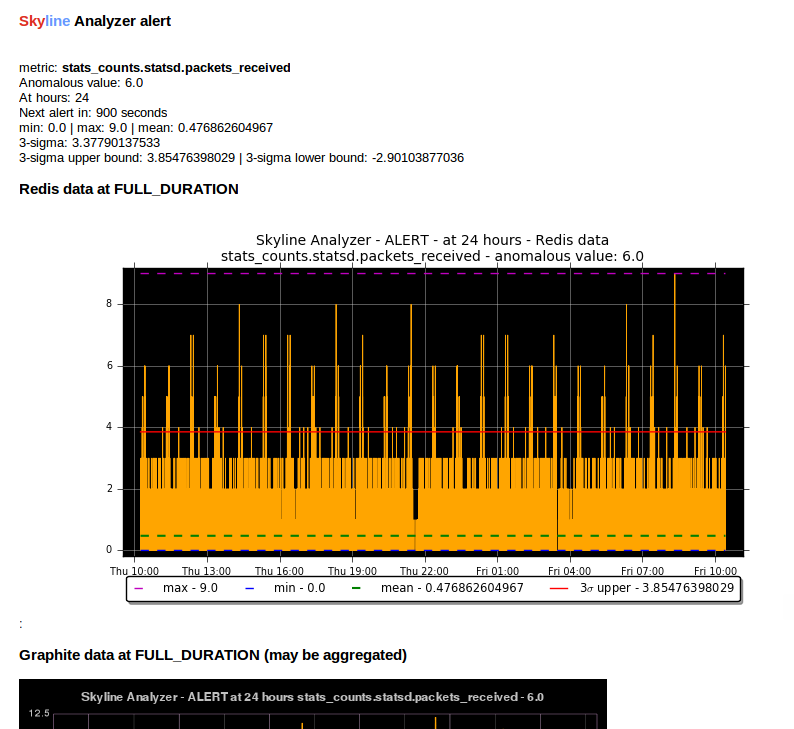
Example of the Redis data graph in the alert
Note
The Redis data graphs do make the alerter a little more CPU when matplotlib plots the alerts and the alert email larger in size.
Monitoring data sparsity
If you have a reliable metrics pipeline this generally is not required, however
the Analyzer metrics_manager can be enabled to monitor how sparsely populated
the metric population is. If the Analyzer metrics_manager is enabled via
settings.CHECK_DATA_SPARSITY, the metric population will be analysed
every RUN_EVERY (which for metrics_manager is 300 seconds) and the
resolution of each metric will be dynamically determined from the timeseries
data, the expected number of data points in settings.FULL_DURATION will
be determined and the data sparsity value will be calculated for each metric.
A data sparsity of 100% means that the metric is fully populated, as the value
decreases the metric data becomes increasingly sparsely populated (bad).
Enabling settings.CHECK_DATA_SPARSITY results in Skyline sending 4 new
metrics to Graphite:
- skyline.analyzer.<HOSTNAME>.metrics_sparsity.avg_sparsity - the average sparsity e.g.
sum(all_sparsities) / len(all_sparsities) - skyline.analyzer.<HOSTNAME>.metrics_sparsity.metrics_fully_populated - the number of metrics fully (or over populated)
- skyline.analyzer.<HOSTNAME>.metrics_sparsity.metrics_sparsity_increasing - the number of metrics becoming more sparsely populated (bad)
- skyline.analyzer.<HOSTNAME>.metrics_sparsity.metrics_sparsity_increasing - the number of metrics becoming more densely populated (good)
Across the entire population, these are the key metrics regarding the reliability of incoming metrics. An increasing skyline.analyzer.<HOSTNAME>.metrics_sparsity.metrics_sparsity_increasing metric indicates that the metric data submission is degraded and could indicate a problem.
Of course there may be some metrics that are not expected to send values
frequently but only occasionally, if you wish to exclude these types of metrics
they can be declared in settings.SKIP_CHECK_DATA_SPARSITY_NAMESPACES.
What Analyzer does
- Analyzer determines all unique metrics in Redis and divides them
between
settings.ANALYZER_PROCESSESto be analysed betweenspin_processprocesses. - The spawned
spin_processprocesses pull the all time series for theirassigned_metricsthey have been assigned from Redis and iterate through each metric and analyse the time series against thesettings.ALGORITHMSdeclared in the settings.py - The
spin_processwill add any metric that it finds anomalous (triggerssettings.CONSENSUSnumber of algorithms) to a list of anomalous_metrics. - The parent Analyzer process will then check every metric in the
anomalous_metrics list to see if:
- If the metric matches an
settings.ALERTStuple in settings.py - If a Mirage SECOND_ORDER_RESOLUTION_HOURS parameter is set in the tuple, then Analyzer does not alert, but hands the metric off to Mirage by adding a Mirage check file.
- If a metric is an Ionosphere enabled metric (and not a Mirage metric), then Analyzer does not alert, but sends the metric to Ionosphere by adding an Ionosphere check file.
- If
ENABLE_CRUCIBLEis True, Analyzer adds the time series as a json file and a Crucible check file. - If no Mirage parameter, but the metric matches an
settings.ALERTStuple namespace, Analyzer then checks if an Analyzer alert key exists for the metric by querying the metric’s Analyzer alert key in Redis. - If no alert key, Analyzer sends alert/s to the configured alerters
and sets the metric’s Analyzer alert key for
settings.EXPIRATION_TIMEseconds. - Analyzer will alert for an Analyzer metric that has been returned from Ionosphere as anomalous having not matched any known features profile or layers.
- If the metric matches an
- Analyzer also runs a metrics_manager process that runs every
RUN_EVERYseconds (currently 300 seconds). This process is responsible for all metric classification in terms of determining what metrics are Mirage metrics, low priority metrics, what metrics are assigned to each alert group, etc. This is a separate process that run isolated from the analysis processes as these classifications some that they do not impact the analysis run time. metrics_manager creates Redis keys, sets and hash key for the various things which are consumed by the other apps.