Analyzer
The Analyzer service is responsible for analyzing collected data. It has
a very simple divide-and-conquer strategy. It first checks Redis to get
the total number of metrics stored, and then it fires up a number of
processes equal to settings.ANALYZER_PROCESSES, assigning each
processes a number of metrics. Analyzing a metric is a very
CPU-intensive process, because each timeseries must be decoded from
Messagepack and then run through the algorithms. Analyzer is also routes
metric checks to other services (Mirage, Panorama and Ionosphere) for
further analysis or recording an anomaly event, as appropriately.
Due to Analyzer being the most CPU-intensive Skyline process, it is advisable to
set settings.ANALYZER_PROCESSES to about the number of cores you have -
leaving a few for the Skyline services and Redis.
The original documentation and settings for skyline were based on:
a flow of about 5k metrics coming in every second on average (with 250k distinct metrics). We use a 32 core Sandy Bridge box, with 64 gb of memory. We experience bursts of up to 70k TPS on Redis
Skyline runs OK on much less. It can handle ~45000 metrics per minute on
a 4 vCore, 4GB RAM cloud SSD server, even before the introduction of the
settings.RUN_OPTIMIZED_WORKFLOW methodology.
Do read the notes in settings.py related to the
settings.ANALYZER_PROCESSES settings.ANALYZER_OPTIMUM_RUN_DURATION
if you are only processing a few 1000 metrics with a data point every minute
then the optimum settings will most likely be something similar to:
ANALYZER_PROCESSES = 1
ANALYZER_OPTIMUM_RUN_DURATION = 60
Python multiprocessing is not very efficient if it is not need, in fact the overall overhead of the spawned processes ends up greater than the overhead of processing with a single process.
See Optimizations results and Analyzer Optimizations
Algorithms
Skyline Analyzer was designed to handle a very large number of metrics, for which picking models by hand would prove infeasible. As such, Skyline Analyzer relies upon the consensus of an ensemble of a few different algorithms. If the majority of algorithms agree that any given metric is anomalous, the metric will be classified as anomalous. It may then be surfaced to the Webapp or pushed to Mirage, if Mirage is enabled and configured for the namespace of the anomalous metric.
Currently, Skyline does not come with very many algorithmic batteries included. This is by design. Included are a few algorithms to get you started, but you are not obligated to use them and are encouraged to extend them to accommodate your particular data. Indeed, you are ultimately responsible for using the proper statistical tools the correct way with respect to your data.
Of course, we welcome all pull requests containing additional algorithms
to make this tool as robust as possible. To this end, the algorithms
were designed to be very easy to extend and modify. All algorithms are
located in algorithms.py. To add an algorithm to the ensemble, simply
define your algorithm and add the name of your settings.ALGORITHMS.
Make sure your algorithm returns either True, False or None, and be
sure to update the settings.CONSENSUS setting appropriately.
Algorithm philosophy
The basic algorithm is based on 3-sigma, derived from Shewhart’s statistical process control. However, you are not limited to 3-sigma based algorithms if you do not want to use them - as long as you return a boolean, you can add any sort of algorithm you like to run on timeseries and vote.
Explanation of Exceptions
TooShort: The timeseries was too short, as defined in
settings.MIN_TOLERABLE_LENGTH
Incomplete: The timeseries was less than settings.FULL_DURATION
seconds long
Stale: The timeseries has not received a new metric in more than
settings.STALE_PERIOD seconds
Boring: The timeseries has been the same value for the past
settings.MAX_TOLERABLE_BOREDOM seconds
Other: There’s probably an error in the code, if you’ve been making changes or we have.
Metrics monotonicity
Analyzer is used to identify what metric timeseries are strictly increasing monotonically, metrics that have an incrementing increasing count, so that these timeseriers can be handled via their derivative products where appropriate. For full details see Monotonic metrics
Push to Mirage
Analyzer can push anomalous metrics that have a seasonality /
periodicity that is greater than settings.FULL_DURATION to the Mirage
service, see Mirage.
Analyzer settings.ALERTS
Order Matters
In terms of the settings.ALERTS order matters in Analyzer and in the
Mirage context as well.
Warning
It is important to note that Analyzer uses the first alert tuple that matches.
So for example, with some annotation. Let us say we have a set of metrics related to how many requests are made per customer. We have two very important customers which we have tight SLAs and we want to know very quickly if there is ANY anomalies in the number of requests they are doing as it has immediate effect on our revenue. We have other customers too, we want to know there is a problem but we do not want to be nagged, just reminded about them every hour if there are anomalous changes.
ALERTS = (
           ('skyline', 'smtp', 3600),
           ('stats.requests.bigcheese_customer', 'smtp', 600),    # --> alert every 10 mins
           ('stats.requests.biggercheese_customer', 'smtp', 600), # --> alert every 10 mins
           ('stats.requests\..*', 'smtp', 3600),                  # --> alert every 60 mins
)
The above would ensure if Analyzer found bigcheese_customer or biggercheese_customer metrics anomalous, they would fire off an alert every 10 minutes, but for all other metrics in the namespace, Analyzer would only fire off an alert every hour if they were found to be anomalous.
The below would NOT have the desired effect of analysing the metrics for bigcheese_customer and biggercheese_customer
ALERTS = (
           ('skyline', 'smtp', 3600),
           ('stats.requests\..*', 'smtp', 3600),                  # --> alert every 60 mins
           ('stats.requests.bigcheese_customer', 'smtp', 600),    # --> NEVER REACHED
           ('stats.requests.biggercheese_customer', 'smtp', 600), # --> NEVER REACHED
)
Hopefully it is clear that Analyzer would not reach the bigcheese_customer and
biggercheese_customer alert tuples as in the above example the
stats.requests\..* tuple would match BEFORE the specific tuples were
evaluated and the bigcheese metrics would be alerted on every 60 mins instead of
the desired every 10 minutes.
Please refer to Mirage - Order Matters section for a similar example of how order matters in the Mirage context.
Analyzer SMTP alert graphs
Analyzer by default now sends 2 graphs in any SMTP alert. The original Graphite graph is sent and an additional graph image is sent that is plotted using the actual Redis timeseries data for the metric.
The Redis data graph has been added to make it specifically clear as to the data that Analyzer is alerting on. Often your metrics are aggregated in Graphite and a Graphite graph is not the exact representation of the timeseries data that triggered the alert, so having both is clearer.
The Redis data graph also adds the mean and the 3-sigma boundaries to the plot, which is useful for brain training. This goes against the “less is more (effective)” data visualization philosophy, however if the human neocortex is presented with 3-sigma boundaries enough times, it will probably eventually be able to calculate 3-sigma boundaries in any timeseries, reasonably well.
Bearing in mind that when we view anomalous timeseries in the UI we are presented with a red line depicting the anomalous range, this graph just does the similar in the alert context.
Should you wish to disable the Redis data graph and simply have the Graphite
graph, simply set settings.PLOT_REDIS_DATA to False.
Example alert
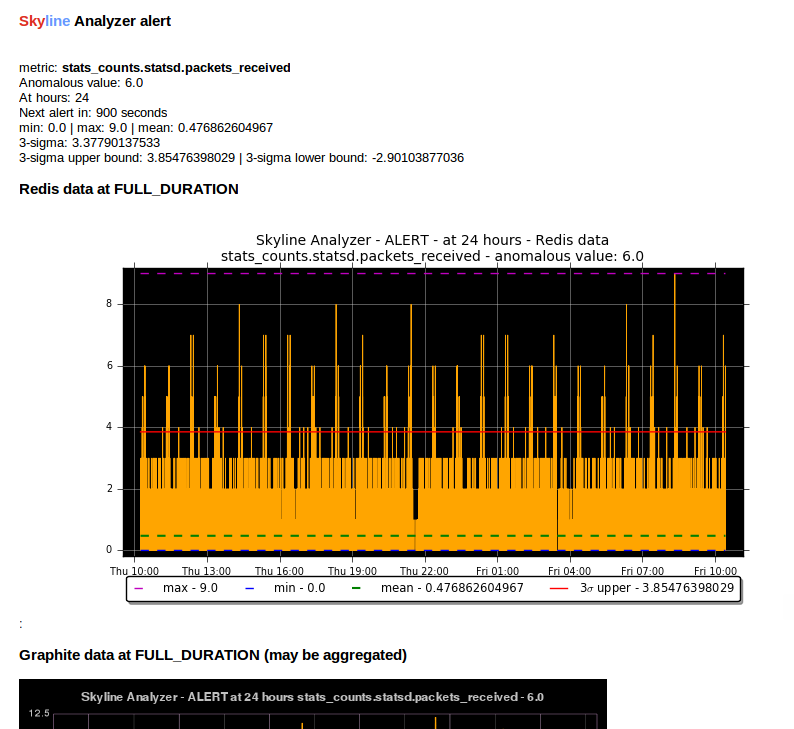
Example of the Redis data graph in the alert
Note
The Redis data graphs do make the alerter a little more CPU when matplotlib plots the alerts and the alert email larger in size.
What Analyzer does
- Analyzer determines all unique metrics in Redis and divides them
between
settings.ANALYZER_PROCESSESto be analysed betweenspin_processprocesses. - The spawned
spin_processprocesses pull the all timeseries for theirassigned_metricsthey have been assigned from Redis and iterate through each metric and analyze the timeseries against thesettings.ALGORITHMSdeclared in the settings.py - The
spin_processwill add any metric that it finds anomalous (triggerssettings.CONSENSUSnumber of algorithms) to a list of anomalous_metrics. - The parent Analyzer process will then check every metric in the
anomalous_metrics list to see if:
- If the metric matches an
settings.ALERTStuple in settings.py - If a Mirage parameter is set in the tuple, then Analyzer does not alert, but hands the metric off to Mirage by adding a Mirage check file.
- If a metric is an Ionosphere enabled metric, then Analyzer does not alert, but hands the metric off to Ionosphere by adding an Ionosphere check file.
- If
ENABLE_CRUCIBLEis True, Analyzer adds timeseries as a json file and a Crucible check file. - If no Mirage parameter, but the metric matches an
settings.ALERTStuple namespace, Analyzer then checks if an Analyzer alert key exists for the metric by querying the metric’s Analyzer alert key in Redis. - If no alert key, Analyzer sends alert/s to the configured alerters
and sets the metric’s Analyzer alert key for
settings.EXPIRATION_TIMEseconds. - Analyzer will alert for an Analyzer metric that has been returned from Ionosphere as anomalous having not matched any known features profile or layers.
- If the metric matches an